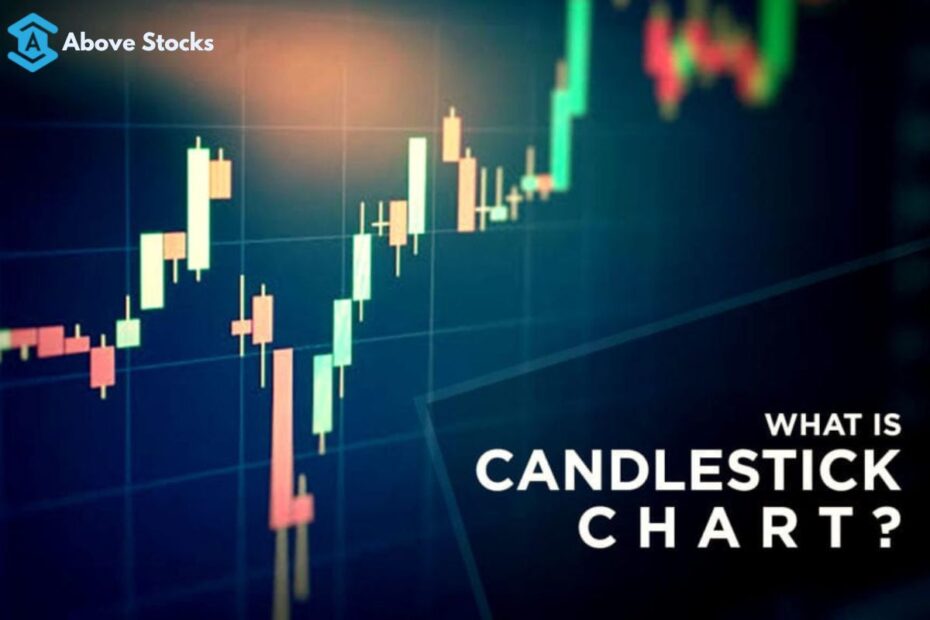
In the financial trading market, the analyst uses many chart patterns like Bar chart, Line chart, Renko, Heikin Ashi, etc. and keep predicting future price movements. The candlestick is the most commonly used chart pattern by the analysts. Candlestick is a price chart that is used to display the price behavior of the particular trading index or stocks with respect to a particular time. A Japanese man named Homma discovered the candlesticks that’s why it also called Japanese candlesticks. A candlestick has four price points (Open, High, Low and Close) which are used by the analyst to determine the future price movements.

As in the graph above, a candle has four price points. The portion from open to close is called the ‘Real body’ of the candle. Upperside shadow is known as high and the lower side shadow known as low.
Candlestick has two types of the candle are known by Bullish and Bearish Candle. The Bullish candles are normally shown in green or white and Bearish candle are shown in red or black on the chart. The Bullish or green candle represents the upside movement and the bearish candle represents the downside movements.
Bullish candle
While a candle closed above its open price then it is considered as a bullish candle. Say for example, if an X stock’s price opens at Rs. 100 and closed at 105 (above 100) then it is a bullish candle.
Bearish Candle
While a candle closed below its open price then it is considered as a bearish candle. Say for example, if an X stock’s price opens at Rs. 100 and closed at 95 (below 100) then it is a bearish candle.

Above is a daily candlestick chart and, each candle presenting the one-day movements. As can be seen in the chart, green is a bullish candle and red is a bearish candle.
Candle size is also the most important because of the size of the candle showing the strength of the buyer and seller. If on the chart a long bullish or green candle formed on a particular time frame, then it is considered as the buyers have more strength and when a bearish candle formed then it is considered as the seller are more strength.
